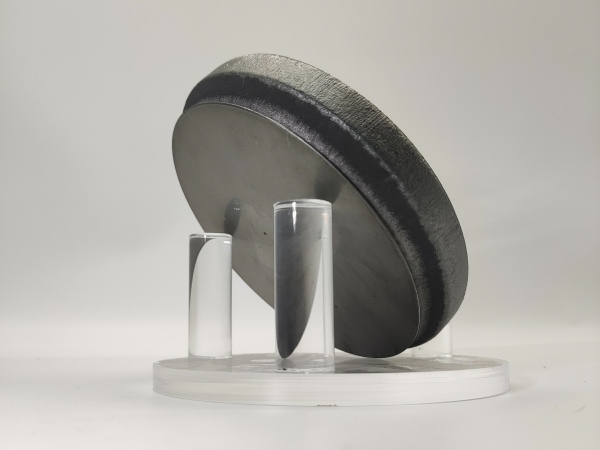
How long a substrate lasts can rarely be captured by a single "total irradiation dose" number. The same batch of UV-grade fused silica substrates, mounted on excimer laser windows, shows completely different transmission-drift curves on the first power-on versus the dozenth: the material's response to radiation depends strongly on its own irradiation history. The practical implication for procurement and acceptance is direct: running a single aging test gives you the "ideal first-use" curve, whereas real operation is a repeated cycle of lamp-on and lamp-off. What actually belongs in the datasheet is how the substrate accumulates damage across cycles—and how it recovers.
Two Distinct Events Occur Inside the Substrate During Lamp-On and Lamp-Off
Leave the substrate inside the EPR cavity and measure continuously, acquiring a spectrum every 30 seconds, with the UV lamp switched on and off three times; the true internal evolution is then read out directly. During the lamp-on phase, the central Ge–E' signal grows continuously and exponentially, indicating that Ge–E' is the dominant paramagnetic product at this stage. Once the lamp is turned off, Ge–E' decays rapidly while the Ge–E'H doublet (119 G) grows in synchronously in a burst. This is a classic dark reaction: Ge–E', acting as a precursor, captures mobile hydrogen and converts into the more thermally stable Ge–E'H complex. On the next lamp-on, the process reverses—Ge–E' regenerates quickly and Ge–E'H is suppressed.
The engineering implication for substrate parts is this: a UV window undergoes two distinct optical states during "light–dark" cycling, and a short shutdown is not a static state—the interior of the substrate is still restructuring. In applications requiring low drift and low fluorescence, acceptance criteria cannot read only "post-irradiation transmission"; they must also specify "recovery behavior after several hours of shutdown."
 Figure 1. Three-dimensional schematic of in-situ UV-irradiation EPR spectra of JGS2, fully recording three on/off cycles of the UV lamp.
The Dark-State Recovery Time Can Be Quantified
Fitting the time-evolution curves with a bi-exponential function (coefficient of determination R² ≥ 0.95), in the first lamp-off cycle Ge–E' decays with two rate constants of 5.83 h⁻¹ and 0.624 h⁻¹, while Ge–E'H grows with 5.99 h⁻¹ and 0.628 h⁻¹. The two pairs are nearly perfect mirror images, and the fast component accounts for about 54% in both. This strict coupling indicates that hydrogen capture is a direct process rather than an indirect electrostatic drift; the bi-exponential form corresponds to two spatial pathways: roughly 54–68% of the fast component is short-range recombination (hydrogen still remains near the activated Ge site), while roughly 32–46% of the slow component is long-range diffusion (hydrogen has migrated deep into the network or to more distant sites). As a control, dropping the optical power from 200 W to 50 W slows defect generation, but the post-lamp-off shuttle behavior remains consistent and reproducible, indicating that the mechanism does not depend on a single batch or a single flux.
These two rate constants are the quantitative answer to "how long after shutdown does recovery take." A dark-state process measured in hours means that precision UV optical paths have a predictable drift window during the initial warm-up. Specifying dark-state recovery conditions and test methods in the datasheet is far more economical than troubleshooting parts one by one after the fact. For large-aperture or high-value substrates, it is further recommended that the dark-state recovery curve be included in the data delivered with the shipment.
 Figure 2. In-situ 2D EPR contour plot, together with the time-resolved double-integrated intensity curves of Ge–E' (red) and the 119 G Ge–E'H doublet (black, scaled by 1/5).
On the Second Power-On It Is 20× Faster—So Substrates Need a Burn-In Calibration
The more striking number appears between cycles: the first-cycle Ge–E' generation rate is only 1.18 h⁻¹, while the second and third cycles rise above 22 h⁻¹—an increase of more than 20×. The reason lies in the energy pathway: cleaving the newly formed Ge–E'H (hydrogen detrapping) requires far less energy than breaking the intrinsic bonds of the bulk to activate GeODCs. At the same time, the spin population of Ge–E'H under dark conditions is 7.5× higher than that of Ge–E' under UV, while the Ge–E' line width remains unchanged at 0.7 G. This shows that what is seen under illumination is only a limited and instantaneous subset of the defect pool; after lamp-off, hydrogen anchors out a large population of "EPR-silent" three-fold coordinated Ge sites and unstable GeODC fragments, revealing the substrate's full defect inventory.
Translating this into procurement and acceptance, three actions belong in the process. First, require suppliers to state explicitly whether pre-irradiation (burn-in) has been performed and under what dose conditions—burn-in versus no burn-in produces two different transmission-drift curves during the first tens of hours. Second, the lifetime model must include both bi-exponential rate constants; a single exponential cannot describe the dark-state conversion after lamp-off. Third, record both the "first-cycle response" and the "second-cycle response"; their ratio is the quantitative indicator of the memory effect and can be used for batch comparison and incoming-part grading. Hydrogen-containing environments (H₂-loading treatment, hydrogen-rich packaging) simultaneously enhance radiation resistance and accelerate hydrogen shuttling; they should be declared as independent process parameters in the substrate specification, rather than buried under a vague phrase like "high radiation resistance."
There is one more easily overlooked detail: the central Ge–E' accumulates continuously across cycles, while the 119 G doublet reaches nearly the same steady-state intensity in each irradiation phase. This indicates that the Ge–E'H population is limited primarily by the incident flux's hydrogen-dissociation capability, not by the overall size of the defect pool—in other words, the substrate's "saturation behavior" is governed more by optical flux and hydrogen supply than by a linear dependence on total impurity content. This directly affects the design margin for high-power operation.
Substrate Irradiation-Lifetime Acceptance Checklist
- Transmission change curves before and after UV aging (including the below-250 nm band);
- Dark-state recovery curve and recovery time after shutdown (requiring a bi-exponential fit reported in hours);
- First-cycle / second-cycle irradiation response ratio, as an indicator of the memory effect and batch consistency;
- Hydrogen speciation and process declaration (whether H₂-loaded, and the loading conditions);
- Pre-installation burn-in conditions and acceptance thresholds.

Supply and Customization
JXT supplies UV-grade
fused silica substrates with grade and pretreatment options matched to operating conditions. We support customization of dimensions, thickness, surface flatness, and polishing grade, and can provide UV-visible transmission, hydroxyl content, and comparative spectra before and after UV irradiation on a per-project basis, helping customers build their own lifetime-evaluation baseline. Our products target long-term irradiation scenarios such as excimer laser windows, UV lithography illumination, space optics, and high-power UV transmission.